 |
LASP 1.0
Library for Acoustic Signal Processing
|
 |
LASP 1.0
Library for Acoustic Signal Processing
|
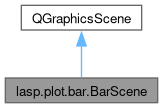
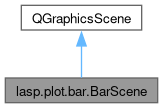
Graphhics Scene for plotting bars. More...


Public Member Functions | |
| __init__ (self, parent, xvals, G, ylim=(0, 1), grid=True, xlabel=None, ylabel=None, title=None, colors=DEFAULT_COLORS, size=(1200, 600), legend=None, legendpos=None) | |
| Initialize a bar scene. | |
| saveAsBitmap (self, fn) | |
| Save bar image as a jpg file. | |
| saveAsPdf (self, fn, force=False) | |
| Save bar image as a eps file. | |
| getBarGroupMidPos (self, n) | |
| Returns the mid x position below each bar group. | |
| getBarRect (self, n, g, yval) | |
| Returns a bar QRectF. | |
| addLine (self, x1, y1, x2, y2, pen=QPen(), brush=QBrush()) | |
| createRect (self, x, y, Lx, Ly, pen=QPen(), brush=QBrush()) | |
| Create a rectangle somewhere, in relative coordinates originating from the lower left position. | |
| set_ydata (self, newydata) | |
Public Attributes | |
| ylim | |
| N | |
| G | |
| bgs | |
| size | |
| xsize | |
| ysize | |
| colors | |
| yticks | |
| lasp.plot.bar.BarScene.__init__ | ( | self, | |
| parent, | |||
| xvals, | |||
| G, | |||
ylim = (0, 1), |
|||
grid = True, |
|||
xlabel = None, |
|||
ylabel = None, |
|||
title = None, |
|||
colors = DEFAULT_COLORS, |
|||
size = (1200, 600), |
|||
legend = None, |
|||
legendpos = None |
|||
| ) |
Initialize a bar scene.
Args: xvals: labels and x positions of the bars G: Number of bars per x value ylim: y limits of the figure xlabel: label below x-axis ylabel: label on left side of the y-axis title: figure title colors: color cycler size: size of the plot in pixels legend: list of legend strings to show. legendpos: position of legend w.r.t. default position, in pixels
| lasp.plot.bar.BarScene.addLine | ( | self, | |
| x1, | |||
| y1, | |||
| x2, | |||
| y2, | |||
pen = QPen(), |
|||
brush = QBrush() |
|||
| ) |
| lasp.plot.bar.BarScene.createRect | ( | self, | |
| x, | |||
| y, | |||
| Lx, | |||
| Ly, | |||
pen = QPen(), |
|||
brush = QBrush() |
|||
| ) |
| lasp.plot.bar.BarScene.getBarGroupMidPos | ( | self, | |
| n | |||
| ) |
| lasp.plot.bar.BarScene.getBarRect | ( | self, | |
| n, | |||
| g, | |||
| yval | |||
| ) |
Returns a bar QRectF.
Args: n: Bar index (i.e. corresponding to a certain frequency band) g: Bar group (i.e. corresponding to a certain quantity) yval: Height of bar, 1 for full lenght, 0 for no length
Returns: QRectF corresponding to the bar at the right place in the scene
| lasp.plot.bar.BarScene.saveAsBitmap | ( | self, | |
| fn | |||
| ) |
Save bar image as a jpg file.
Overwrites a file already existing in filesystem.
https://stackoverflow.com/questions/7451183/how-to-create-image-file\ -from-qgraphicsscene-qgraphicsview#11642517
Args: fn: Filename Returns: True on success
| lasp.plot.bar.BarScene.saveAsPdf | ( | self, | |
| fn, | |||
force = False |
|||
| ) |